Contents
Have you ever looked at a stock chart and felt like it was a puzzle with too many pieces? Stock charts can indeed be daunting, but they are essential tools for anyone looking to make informed investment decisions. By breaking down the process into simple steps, this article will guide you through the basics of how to analyze stock charts, making it accessible for everyone, not just financial experts.
Understanding the Basics
Before diving into the complex patterns and indicators, it’s essential to grasp what stock charts represent and why they are a fundamental tool for traders and investors. Stock charts provide a graphical representation of a stock’s price movement over time, allowing you to observe how different factors like market sentiment, economic events, or company news impact prices. www.stockdbsite.com
Types of Stock Charts
Line Charts: The simplest form, showing the closing price over a set period. Ideal for beginners to get a clear view of price trends without additional noise.
Bar Charts: Offer more detail by showing the opening, high, low, and closing prices (OHLC) for each period. These are more informative than line charts and can highlight price fluctuations within a trading day.
Candlestick Charts: The most informative and widely used among traders. They provide the same information as bar charts but in a way that is easier to interpret patterns and market sentiment.
Key Components of Stock Charts
To effectively analyze a stock chart, you must understand its building blocks:
- Price Axes: The vertical line (Y-axis) represents the price levels.
- Time Axes: The horizontal line (X-axis) shows the time frame.
- Price Bars or Candlesticks: Each represents trading activity for a given period.
Reading Candlestick Patterns
Candlestick patterns can tell you a lot about market sentiment and potential price movements. For instance, a ‘bullish engulfing’ pattern may indicate a buying opportunity, whereas a ‘bearish engulfing’ might suggest a sell.
Identifying Trends
Is the stock consistently making higher highs and higher lows? It’s likely in an uptrend. Conversely, if it’s making lower lows and lower highs, it’s probably in a downtrend. Identifying these trends is crucial for deciding entry and exit points.
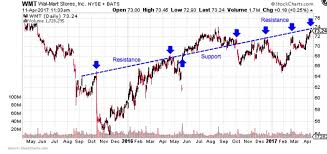
Support and Resistance Levels
These are price levels where the stock historically fails to move past, either downwards (support) or upwards (resistance). Recognizing these can help predict future movements.
Using Technical Indicators
Indicators like Moving Averages, RSI (Relative Strength Index), and MACD (Moving Average Convergence Divergence) can help validate the trends and patterns you observe in the candlestick charts.
Volume Analysis
Volume, the number of shares traded during a given period, often confirms the strength of a trend. High volume during a price increase might indicate strong buy interest.
Combining Multiple Analysis Tools
No single tool can provide all the answers; successful traders often combine various methods to make well-rounded decisions.
Practical Tips for Beginners
Start with simple tools, practice with historical charts, and always keep an eye on the broader market context.
Common Mistakes to Avoid
Avoid common pitfalls like overtrading, ignoring major news events, or relying too heavily on indicators without understanding their limitations.
Resources for Continuous Learning
Continuous learning is key. Consider following financial news sources, engaging with community forums, and practicing with virtual trading accounts.
Conclusion
Analyzing stock charts is both an art and a science. It requires practice, patience, and a good understanding of the basic principles outlined in this guide.